Why Air Quality Changes from Street to Street in Kathmandu
A single citywide AQI can hide important differences between busy roads, residential lanes and open spaces. Discover what creates Kathmandu’s hyperlocal pollution hotspots.
In this article
Understand first
Three things this evidence means for you
- 1A citywide AQI describes general conditions but may not represent the air beside a busy road, inside a school compound or along a quieter residential lane.
- 2Traffic, road dust, buildings, wind, terrain and nearby activities can create pollution hotspots within short distances.
- 3Dense sensor networks, satellite information, weather data and modelling can work together to produce more locally useful air-quality insights.
1. One city does not breathe one kind of air
When people check an air-quality application, they usually see one number assigned to an entire city. That number is useful for understanding the general condition, but it can create the impression that everyone in the city is breathing the same air.
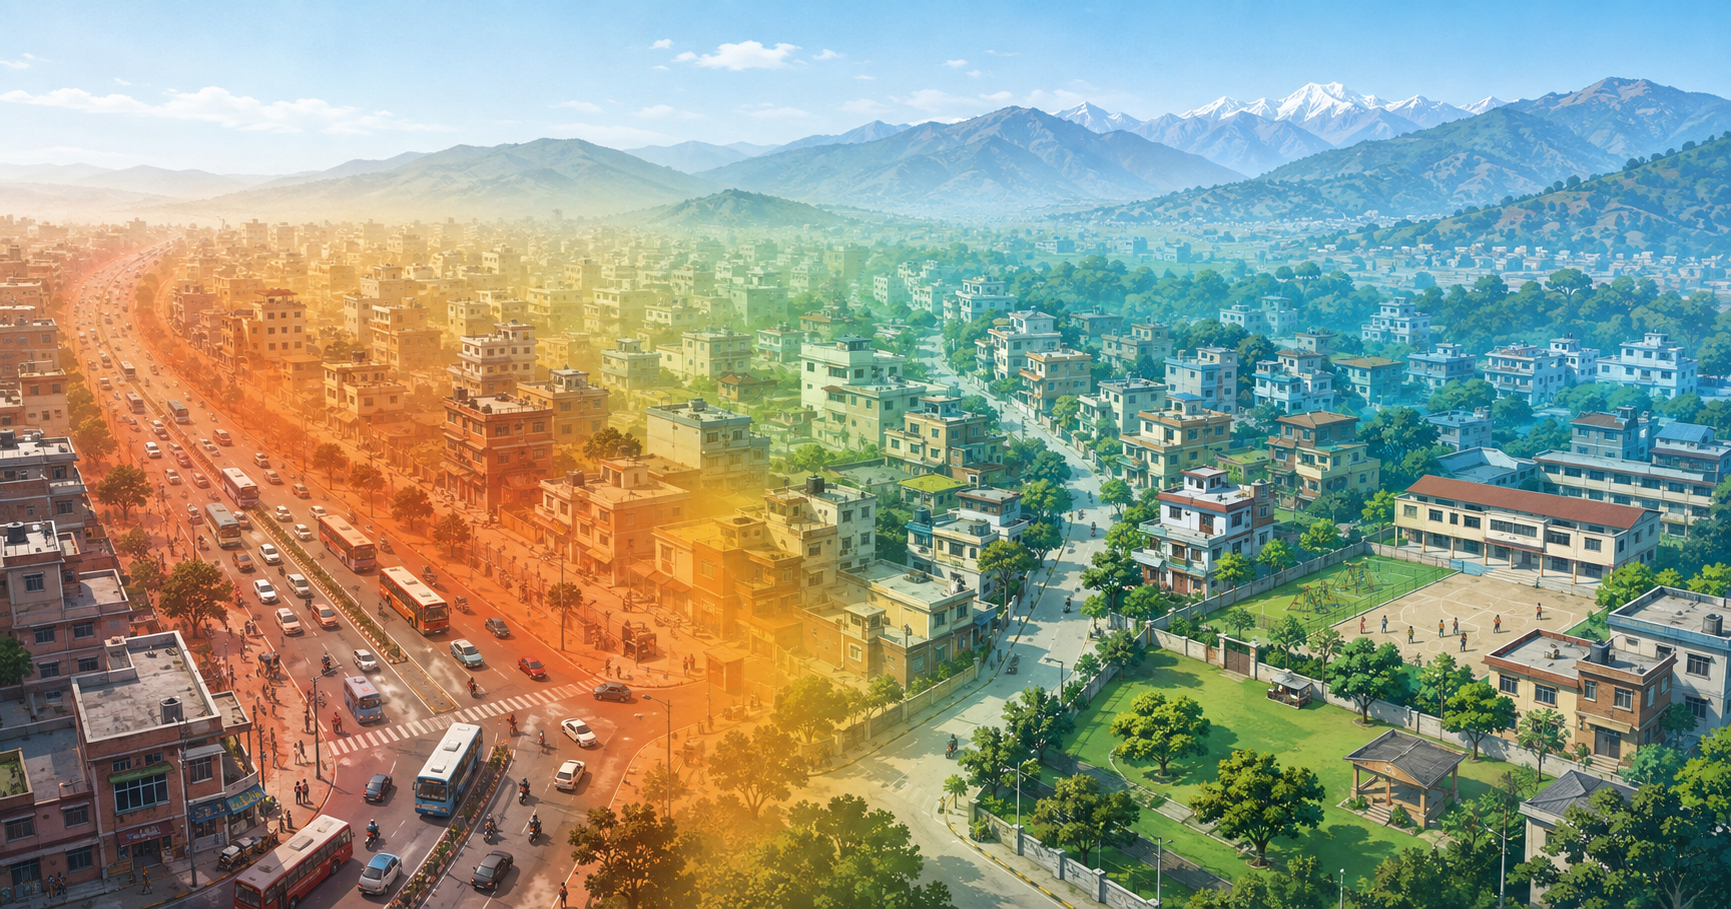
In reality, air pollution is uneven. A person waiting beside a congested intersection may experience different conditions from someone inside a residential courtyard only a short distance away. A school next to a major road may face a different exposure pattern from a school surrounded by open land.
This street-to-street variation is known as hyperlocal air pollution. It matters because people experience pollution where they actually live, walk, study and work—not at the location of a distant monitoring station.
2. Traffic creates local pollution hotspots
Busy roads are among the clearest sources of hyperlocal variation. Vehicles release pollutants through exhaust, while brake wear, tyre wear and resuspended road dust add more particles to the air.
Congestion can make conditions worse. Vehicles repeatedly accelerating, braking and idling concentrate emissions around intersections and narrow road corridors. Heavy diesel vehicles can make a disproportionate contribution to particulate matter and nitrogen oxides.
Research reviewed by the United States Environmental Protection Agency shows that roadway pollution is generally highest on or immediately downwind of busy roads. Concentrations usually decline with distance, although the pattern changes according to the pollutant, traffic volume, wind, terrain and surrounding buildings.
This means that a city-level AQI may correctly describe Kathmandu’s general air quality while still missing a temporary hotspot beside a crowded road.
3. Buildings can trap or redirect pollution
Kathmandu’s urban form also influences how pollution moves. In areas where tall or closely spaced buildings line both sides of a road, the street can behave like a canyon. Air circulation becomes restricted, allowing emissions to accumulate near pedestrians, shops and homes.
Buildings can also redirect wind. One side of a street may receive cleaner moving air while another side experiences slower airflow and higher pollutant concentrations. Courtyards, walls, flyovers and narrow lanes can further change the local pattern.
Open spaces generally allow pollutants to disperse more easily, although they are not automatically pollution-free. Their conditions still depend on nearby sources, wind direction and regional pollution.
Vegetation may help intercept some particles and separate people from traffic, but poorly positioned or extremely dense vegetation can sometimes restrict airflow. Urban design therefore needs to consider both greenery and ventilation.
4. Weather and terrain change the picture
Air pollution does not remain fixed after it is emitted. Wind speed and direction determine where pollutants travel. Stronger winds often disperse pollution, while calm conditions allow it to accumulate near the source.
Temperature inversions can trap polluted air close to the ground, particularly during cold and calm mornings. Kathmandu Valley’s surrounding hills can limit regional ventilation, making these conditions more persistent.
Humidity and rainfall also affect particulate pollution. Rain can remove particles from the atmosphere, while high humidity can change particle size and influence the readings of some optical sensors.
These factors explain why the same road may show different pollution conditions in the morning, afternoon and evening. They also explain why a hotspot can move as the weather changes.
5. Why a single monitoring station is not enough
Reference-grade monitoring stations are essential because they provide highly controlled and reliable measurements. However, they are expensive to purchase, operate and maintain. A small number of stations cannot describe every neighbourhood, roadside or industrial zone.
Low-cost sensors can help fill this spatial gap by increasing the number of measurement locations. They are particularly useful for identifying patterns, comparing locations and detecting possible hotspots.
However, low-cost sensors must be calibrated, maintained and interpreted carefully. Humidity, temperature, sensor ageing and particle composition can influence their readings. They should complement reference stations rather than replace them.
Satellite observations provide broader regional coverage but do not directly measure what an individual is breathing at street level. Weather data, land use, road networks, satellite observations and ground measurements therefore need to be combined.
6. From city averages to local intelligence
The next generation of air-quality services must answer more than “What is Kathmandu’s AQI?” It should help people understand where pollution is rising, when exposure is likely to be highest and what action they should take.
A locally useful system can combine ground sensors, reference monitors, weather conditions, satellite observations, traffic indicators and statistical or machine-learning models. Each source contributes a different part of the picture.
Ground sensors provide local measurements. Reference stations provide calibration and quality control. Satellites provide regional atmospheric context. Weather explains how pollutants are likely to move and disperse. Models connect these inputs to estimate conditions in places without a physical monitor.
This is the direction VayuDrishti is working toward: turning scattered environmental observations into practical intelligence for citizens, schools, hospitals, industries and cities.
Local context
From Kathmandu Ring Road to a residential lane
Consider someone walking from a busy section of Kathmandu’s Ring Road toward a quieter residential neighbourhood. Near the main road, the person may encounter vehicle exhaust, road dust, buses, trucks and repeated stop-and-go traffic. After moving farther into a residential lane, direct traffic emissions may decrease. However, the air may still be affected by nearby construction, waste burning, household cooking, diesel generators or pollution transported from other parts of the valley. The difference cannot be predicted from distance alone. Wind direction, surrounding buildings, time of day and local activity all matter. A sensor beside the main road and another inside the neighbourhood could therefore record different values at the same time. This example is illustrative and does not represent measurements from a specific Ring Road monitoring campaign.
Now act
Practical recommendations
- Check the citywide AQI before leaving home, but remember that roadside exposure may be higher than the city average.
- Avoid prolonged exercise beside congested roads, especially during morning and evening traffic peaks.
- Choose quieter side streets for walking or cycling when a safe alternative is available.
- Keep children’s play and school assembly areas as far from major traffic corridors as practical.
- Use local monitoring at schools, hospitals, construction sites and workplaces where decisions depend on conditions at the exact location.
- Compare readings over time instead of making decisions from one unexplained sensor value.
- Compare readings over time instead of making decisions from one unexplained sensor value.
- People with respiratory or cardiovascular conditions should follow guidance from qualified health professionals.
Sources and methodology
This article synthesises established evidence about traffic-related pollution, urban dispersion, air-quality monitoring and Kathmandu’s atmospheric conditions. It is an educational explanation, not a report of a new VayuDrishti street-level measurement campaign. The size and duration of a pollution hotspot depend on the pollutant, source, weather, terrain and built environment. Findings from other cities cannot be transferred to Kathmandu without local validation. Low-cost sensors may be affected by humidity, temperature, placement, calibration and ageing. Satellite observations provide broad coverage but require modelling and ground validation to estimate surface-level pollution. AQI represents outdoor air conditions over a defined area and period. It does not measure an individual’s complete personal exposure and should not be treated as medical advice.
- 1.Near Roadway Air Pollution and Health: Frequently Asked Questions.: United States Environmental Protection Agency
- 2. Ambient Outdoor Air Pollution.: World Health Organization.
- 3. High-resolution urban air pollution mapping.: Apte, J. S. et al. Science, 2024
- 4.Particulate matter variability in Kathmandu based on in-situ measurements, remote sensing, and reanalysis data.: Becker, S. et al. Atmospheric Research, 2021.
- 5.Reconstructing the PM2.5 Data Record for the Kathmandu Valley.: Bhatta, S. et al.Atmosphere, 2023.
- 6.Hyperlocal Air Pollution Mapping: A Scalable Transfer-Learning Approach.: Yuan, Z. et al. Environmental Science & Technology, 2024.
Continue learning
Related action guides
 Air Quality 101
Understanding PM2.5 and Its Impact on Health
Learn about the invisible threat of PM2.5 particles and how they affect your respiratory system.
 Air Quality 101
What AQI Is Safe for Walking, Running and Outdoor Exercise?
Use AQI, activity intensity, health status, location and timing to decide when to walk, run, cycle or move exercise indoors.
 Our Research
Kathmandu Air Pollution: Causes, Seasons and Health Effects
Understand why Kathmandu's air becomes polluted, who faces the greatest risk, and which practical actions can reduce exposure today.