PM2.5 vs PM10: What Is the Difference?
Compare PM2.5 and PM10 by size, source, health impact and measurement, with practical steps to reduce particle exposure.
In this article
Understand first
Three things this evidence means for you
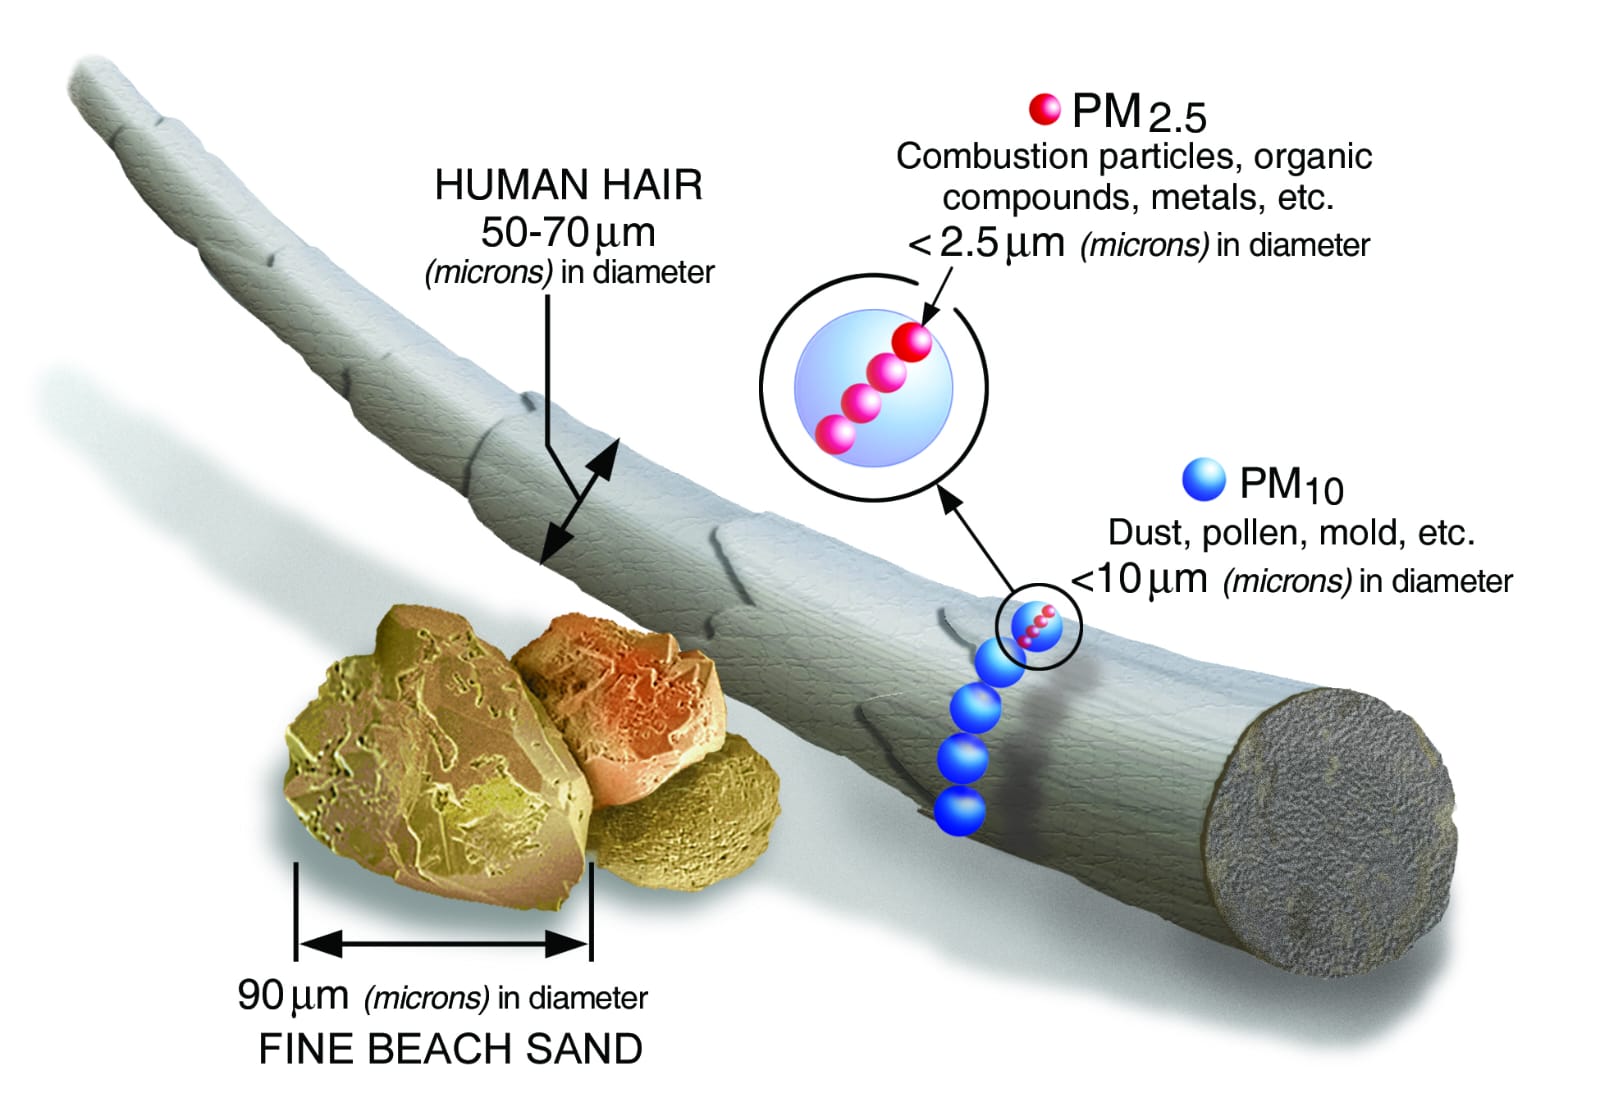
- 1PM10 includes inhalable particles up to 10 micrometres, while PM2.5 is the finer subset up to 2.5 micrometres.
- 2PM2.5 can penetrate more deeply into the lungs and is strongly associated with long-term heart and lung harm.
- 3Concentration and AQI are different values, so check both the unit and the index standard before interpreting a reading.
What particulate matter means
Particulate matter, often shortened to PM, is a mixture of solid particles and liquid droplets suspended in air. It is classified by aerodynamic diameter because size influences where particles travel, how long they remain airborne, and where they can deposit in the respiratory system.
The size difference between PM2.5 and PM10
PM10 refers to inhalable particles with diameters generally 10 micrometres or smaller. PM2.5 refers to fine particles 2.5 micrometres or smaller and is contained within PM10. For scale, a human hair is commonly around 50 to 70 micrometres wide, so both particle groups are much smaller than the hair's width.
Where PM2.5 and PM10 come from
Sources overlap, and one event can raise both size fractions. Visible dust suggests particles are present, but dangerous PM2.5 can remain high even when the air does not look especially dusty.
- PM2.5: vehicle and generator exhaust, industries, brick kilns, cooking and heating smoke, waste burning, and forest fires
- PM10: road and soil dust, construction, crushing, pollen, and larger combustion particles
- Secondary particles: gases that react in the atmosphere to form new particle material
How deeply the particles can travel
The respiratory tract filters some larger particles in the nose and upper airway. Finer particles can reach deeper into the lungs, and components of PM2.5 may enter the bloodstream. This deeper penetration, chemical composition, exposure duration, and total dose help explain concern about fine particle pollution.
PM10 is not harmless. It can irritate the airways and worsen respiratory conditions. Risk is influenced by concentration, time exposed, breathing rate, personal health, and the particles' composition.
WHO guideline values in context
The 2021 WHO air quality guidelines recommend annual averages of 5 micrograms per cubic metre for PM2.5 and 15 for PM10, plus 24-hour values of 15 for PM2.5 and 45 for PM10. These are reference values designed to guide cleaner-air policy and risk reduction.
They should not be described as a line below which there is zero risk. National legal standards can differ from WHO recommendations, and a short sensor reading is not directly comparable with an annual average.
Concentration versus AQI
A concentration reports particle mass per air volume, typically micrograms per cubic metre. An AQI converts a concentration through pollutant-specific breakpoints into a health communication scale. Always read the unit, averaging period, and AQI standard instead of assuming the values mean the same thing.
How VayuDrishti presents particle data
VayuDrishti pairs the overall AQI with pollutant values, location context, an update time, and practical guidance. Quality checks remove impossible or clearly invalid values, while model and sensor uncertainty should remain visible rather than being presented as perfect street-level truth.
Local context
Dust and combustion on one Kathmandu commute
A dusty road can raise PM10 through resuspension, while diesel exhaust and nearby burning can add fine combustion particles. The mixture changes from one street and hour to another. Moving even a short distance away from dense traffic or visible dust can reduce direct exposure, although it does not guarantee clean air.
Now act
Practical recommendations
- Check PM2.5 and PM10 separately when both are available.
- Avoid jogging or cycling beside heavy traffic during particle peaks.
- Reduce indoor smoke from tobacco, incense, frying, candles, and solid-fuel combustion.
- Use correctly sized particle filtration in the room where you spend the most time.
- A well-fitted N95 or equivalent can reduce particle inhalation but does not filter every gas.
- Follow medical advice if pollution repeatedly worsens asthma, heart, or lung symptoms.
Sources and methodology
Particle-size definitions and health statements are based on WHO and EPA materials. Guideline concentrations are health-based recommendations, not a boundary between harmless and harmful air. Sensor and model values include uncertainty and may not capture a person's exact exposure.
- 1.Types of air pollutants: World Health Organization
- 2.WHO global air quality guidelines: World Health Organization
- 3.Particulate matter basics: US Environmental Protection Agency
Continue learning
Related action guides
Air Quality 101Understanding PM2.5 and Its Impact on Health
Learn about the invisible threat of PM2.5 particles and how they affect your respiratory system.
 Air Quality 101
Why Air Quality Changes from Street to Street in Kathmandu
A single citywide AQI can hide important differences between busy roads, residential lanes and open spaces. Discover what creates Kathmandu’s hyperlocal pollution hotspots.
 Air Quality 101
What AQI Is Safe for Walking, Running and Outdoor Exercise?
Use AQI, activity intensity, health status, location and timing to decide when to walk, run, cycle or move exercise indoors.